
Last week, the NFP missed expectations for a second time in a row and the previous numbers were all revised lower. This was seen as a disappointment as the labour market seems to be a touch weaker than previously expected. Nonetheless, the unemployment rate fell once again and lessened the disappointment from the miss in the payrolls number. The worse part for the Fed is that the average hourly earnings beat expectations, and such high wage growth is not consistent with a sustainable return to the 2% target. It’s worth reminding though, that the Fed will see another NFP report before the September meeting, so this NFP doesn’t change much, but the data leading into the meeting can still weigh on sentiment.
S&P 500 Technical Analysis – Daily Timeframe
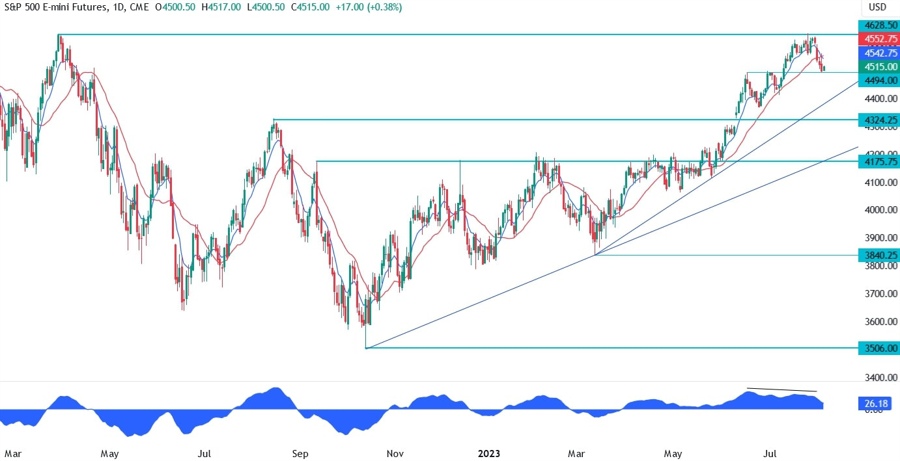
On the daily chart, we can see that the S&P 500 sold off from the 4628 high and even broke below the red 21 moving average. This turns the bias more bearish as the moving averages have also crossed to the downside, but much will depend on what happens here at the 4494 support. In fact, we should see the buyers stepping in here with a defined risk below the level to target again the high and eventually the breakout. The sellers, on the other hand, will want to see the price breaking lower to pile in even more aggressively and extend the fall into the trendline.
S&P 500 Technical Analysis – 4 hour Timeframe

On the 4 hour chart, we can see that the S&P 500 has recently broke below a key short term support around the 4560 level and then pulled back to retest it. The sellers leant on the level as they had confluence with the red 21 moving average and the 38.2% Fibonacci retracement level. If the buyers manage to get a rally all the way back to the level, we should expect the sellers to defend the level again as a break higher would open the door for new highs.
S&P 500 Technical Analysis – 1 hour Timeframe

On the 1 hour chart, we can see that we have a divergence with the MACD right at the 4494 support. This is generally a sign of weakening momentum often followed by pullbacks or reversals. In this case, if the price breaks above the most recent swing level at 4518 where we have also the 38.2% Fibonacci retracement level and the 21 moving average, the buyers will have more control and are likely to take the price into the 4560 resistance. The sellers, on the other hand, should pile in again at this short-term resistance to target a break below the 4494 support.
Upcoming Events
This week the main event will be the US CPI report on Thursday. The market has been loving the disinflationary trend seen in the past months, so an upside surprise is likely to weigh on risk sentiment and push the market lower. On the other hand, another miss in the data should provide some relief and lead to a rally. After the US CPI we will also see the latest US Jobless Claims report, which is less likely to move the market since it’s released at the same time of the CPI, but big surprises should have an effect nonetheless. Finally, we conclude the week with the University of Michigan Consumer Sentiment report on Friday where the market is likely to focus more on the inflation expectations figures.
See also the video below:

