The US 10 year yield is moving to a new high at 2.869%. The current yield is at 2.853% as I type.
That high has taken the yield to a new high for the week surpassing the 2.849% level reached on Wednesday. The high yield reached 2.869%. The current yield is trading at 2.853%.
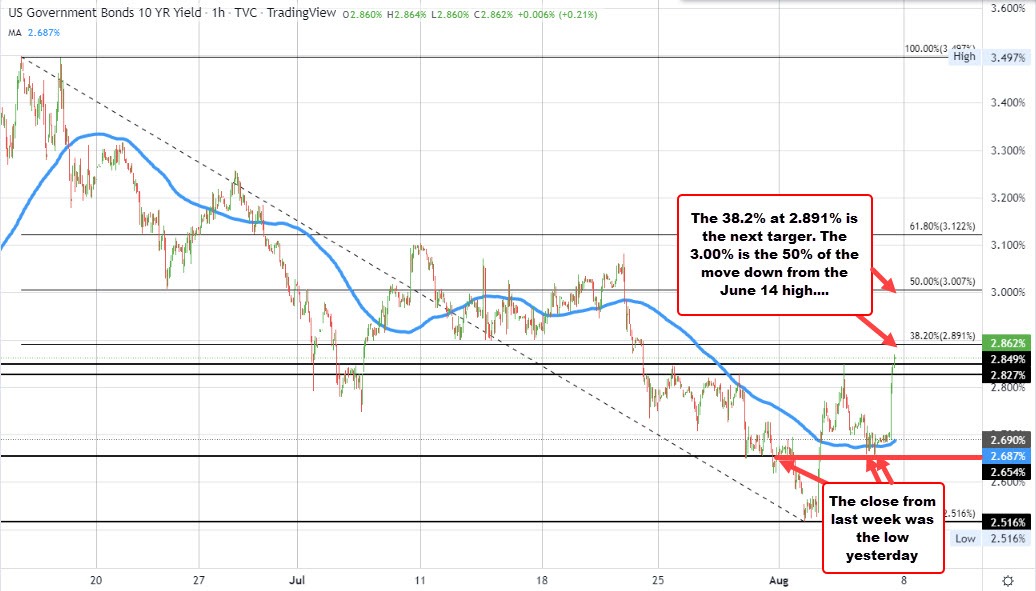
The next target comes in at the 38.2% retracement of the move down from the June 14 high. Move above that level and the door opens for a run toward the 50% midpoint of the same move down at a nice round 3.00% level.
Of interest technically is that the low yield yesterday stalled right at the closing level from last week at 2.654%. The price did dipped below its 100 hour moving average on a few occasions, but reestablish support against that moving average level before launching higher after the much better-than-expected jobs data.
It seems that moving back to 3% would be a given since the Fed is now likely to strongly consider 75 basis points in September vs. 50.
However, CPI data next week will be another key data point that Fed officials have been saying they are focused on.
Remember, Fed officials this week made it clear that being data dependent does not mean that the Fed will stop tightening. Being data dependent is the difference between 50 basis points and 75 basis points. Inflation is obviously a major component as is the strong employment which Fed officials also comment that there is no letting up. That was evident in the numbers today (even if it is a lagging indicator). What will the CPI's data say?.
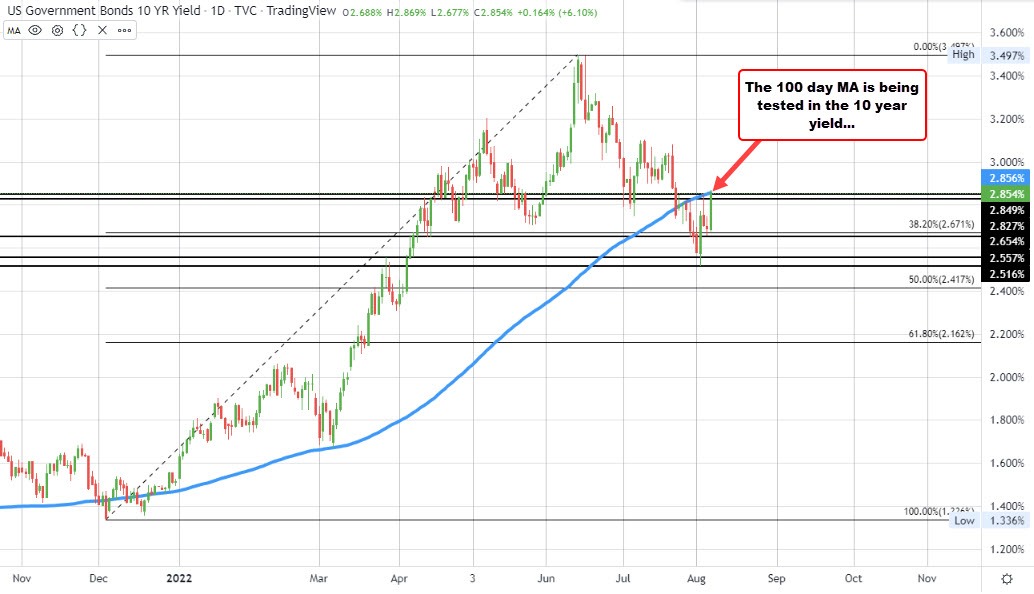
PS. If you look at the daily chart of the 10 year yield below, the 100 day moving average is at 2.856%. The high yield today reached 2.869% so far. The current yield is at 2.85%
Moving back above the 100 day moving average would be a tilt back in the upside direction for yields. Perhaps is the most important technical barometer for yields going forward.