
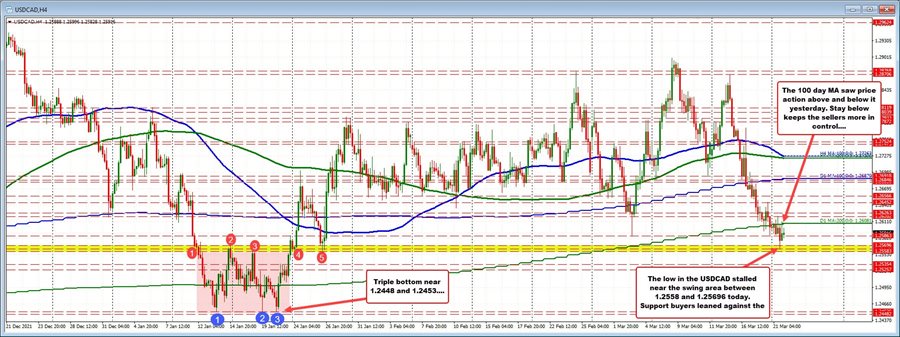
The USDCAD traded above and below its 200 day moving average yesterday. That moving average comes in at 1.26081 (lower green line) , but most of the four-hour bars on the chart above, closed below that moving average level, giving a negative tilt from a technical perspective.
The price closed below the moving average level at 1.25899. Stay below keeps the sellers more control.
On the downside, the low price from yesterday did find some support near a key swing area between 1.2558 and 1.25696.
Going back to January 12 to January 24, the price fell below that level and used that area as a ceiling. On January 24, the price moved back above the swing area, and then had one last test of the area on January 26.
The price held (see red numbered circle 5 in the chart above) has not been back to that area since today. Buyers leaned against the area and pushed the price off of that level.
Going forward, that the swing area - if broken - would send the price back into the extreme lows seen from mid-January between 1.25696 and 1.24482. The lower extreme had three separate lows between 1.2448 and 1.24535 and as such, remains a key level to get to and through on more weakness.
What would hurt the downside momentum?
A move back above 200 day MA would give dip buyers some initial comfort with the 1.2626 level and the 1.2645 to 1.26566 area as the next upside targets.

