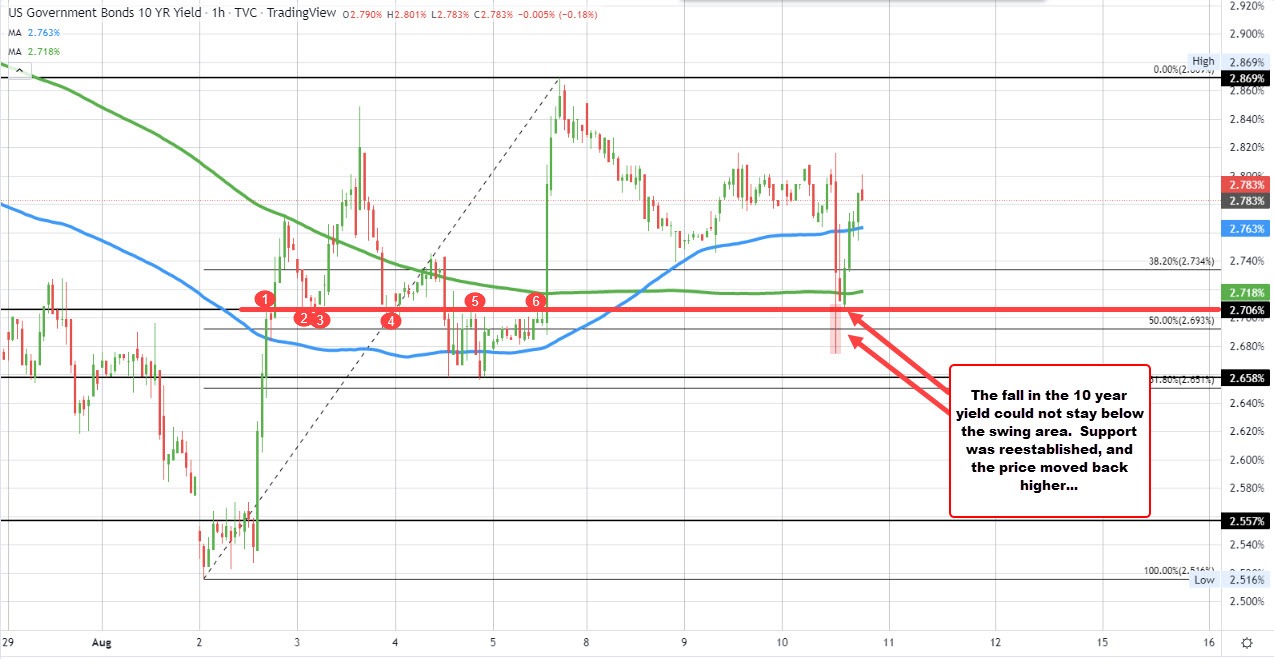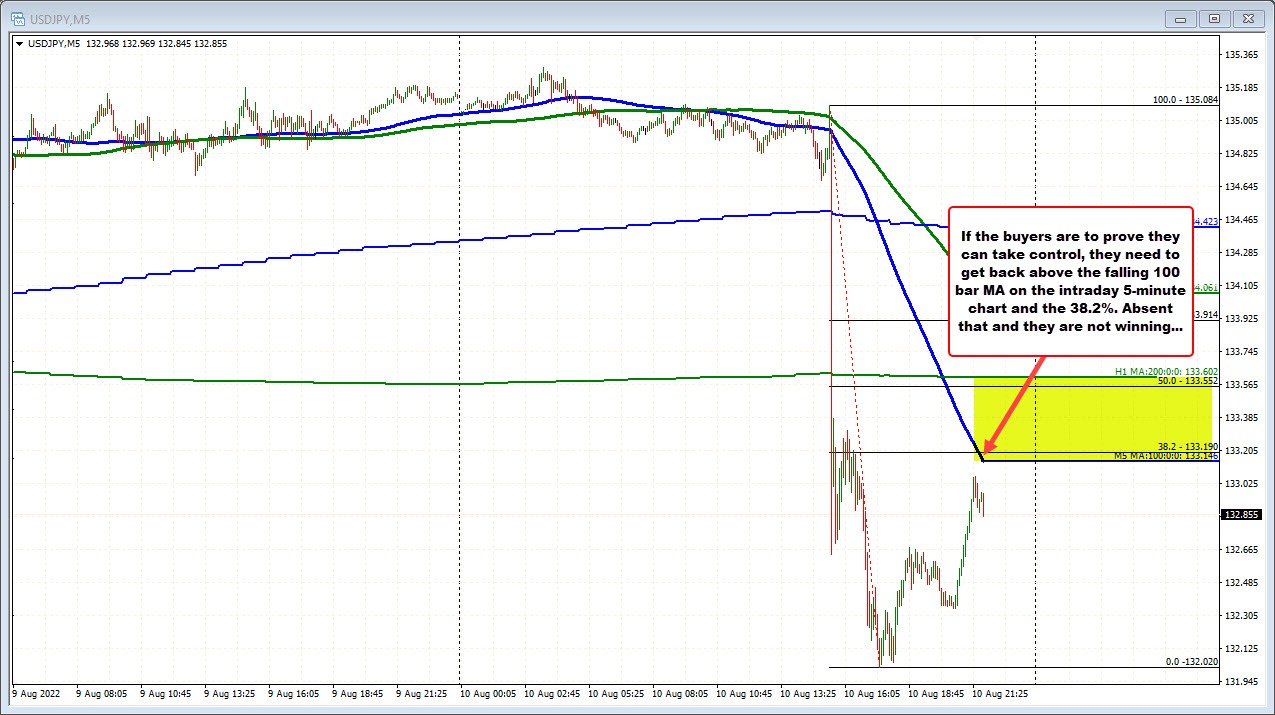
The US yields have seen a bounce back to the upside which helped to slow the USDJPY fall and has led to bounce higher.
Looking at the 10 year yield, the level moved back above the 100 hour MA at 2.763% after dipping to an intraday low at 2.675% soon after the data release. Looking at the hourly chart, the yield moved below a swing level at 2.706% and the 50% of the move up from the August low at 2.691%, but could not sustain momentum below those levels and traders started to lean at the 2.706% before marching above the 100 hour MA again.
That 100 hour MA at 2.763% is now support on a dip.
Looking at the 5 minute chart of the USDJPY, the rebound off the low has seen the pair move up toward intraday resistance at the 38.2% of the move down from the pre-CPI high at 133.19 and the falling 100 bar MA (blue line) just below that level.
When the price trends lower like it did, the sellers were the one way show. When there is a correction, there is an opportunity for those sellers to show/prove they can keep full control of the trend. It is also an opportunity for the buyers to show that THEY can take back control.
For me, if the price cannot get back above the falling/lagging 100 bar MA on the intraday 5-minute chart, and the 38.2% of the trend move down, the buyers are not showing they can take more control and the sellers are showing they can keep control.

Now a break above will not necessarily mean the upside the definitive way to go. Remember the levels are the minimum levels to get to and through to show the buyers can take back some control. However, it does weaken the trend move. More importantly perhaps, is if the price successfully tests and holds below the aforementioned levels, the sellers are given a green light to resume the move lower.


