
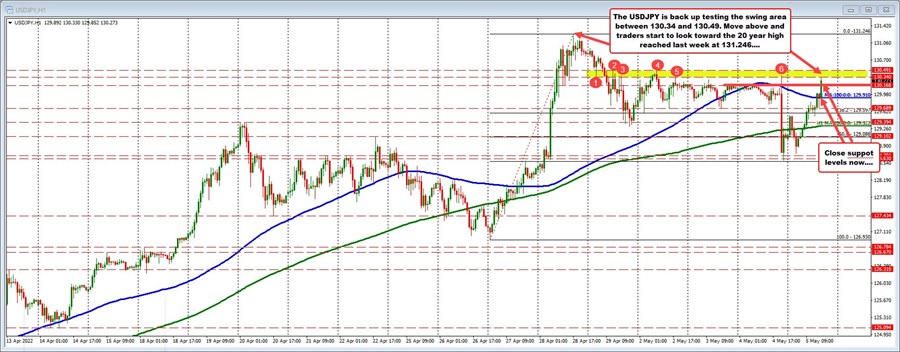
The USDJPY has move back above its 100 hour moving average at 129.91, and now looks toward the high from yesterday at 130.377 and the high from Monday at 130.491. Move above those levels and traders will start to talk about a retest of the 20 year high reached last week at 131.246.
Close risk will now be eyed at the 100 hour moving average at 129.915. A move back below that moving average would neutralize the bias a bit as the price trades back between the lower 200 hour moving average at 129.33 and the 100 hour moving average at 129.915.
Yesterday, the price fell below its 200 hour moving average for the 1st time since April 27. The move lower stalled near the 61.8% retracement of the last leg higher (from the April 27 low) and also a swing area near 128.66.
The sellers had their shot yesterday. The buyers today are squeezing back higher and toward resistance. Can the buying momentum get the price back above the 130.491 low (and stay above)? Or, will the resistance hold and the price break back below the 100 hour moving average?
Helping the run to the upside are that US yields are moving back to the upside after yesterday's declines. The 2 year is trading at 2.703% up 8.7 basis points. The 10 year it is at 3.0385% up 12.4 basis points on the day.
US stocks continue get hammered with the NASDAQ index now down over 420 points or -3.25% at 12542. The S&P is down -95 points or -2.2% at 4205.50, while the Dow is down -634 points or -1.82%.
Crude oil is back above $110 trading at $110.12. That's up $2.25 on the day. The high price reached $111.37.

