The US dollar has had a run to the upside as London and European traders exit for the day and positions are set for the FOMC decision later at 2 PM ET. The NZDUSD has not been left behind in the dollars upward movement.

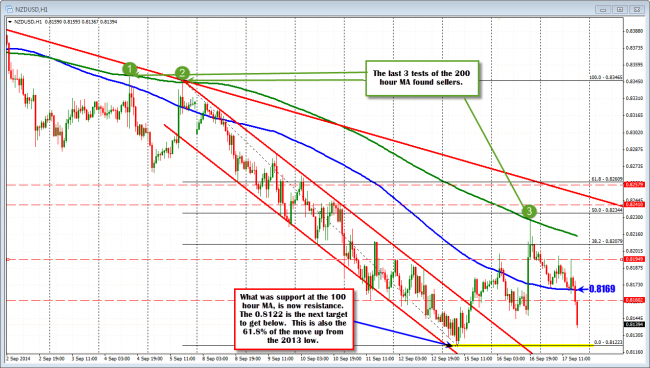
NZDUSD held the 200 hour MA (green line) and broke the 100 hour MA (blue line). This is now resistance (at 0.8169)
Looking at the hourly chart above, the pair moved higher off of the People’s Bank of China liquidity infusion. That took the price right up to the 200 hour moving average (green line), where once again sellers came in and sold. This is the third test of that MA over the last 9 trading days and each time, it held like a charm. Store that in your memory bank for the future as at some point there will be a break above this MA line.
The pairs move back lower today did find support buyers against the 100 hour MA (blue line in the chart above), and like the AUDUSD, traders leaned against the level for support. In the last hour, however, the MA has given way as buyers gave up and sellers took back control. The same dynamic happened in the AUDUSD.
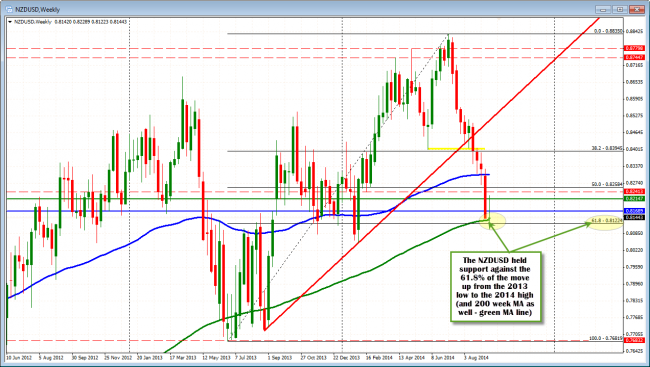
So the price bias is once again bearish with risk now against the 100 hour MA (at 0.8169 – the support now becomes resistance). The low from Monday at 0.81223 should find some profit taking but a break below should trigger stops. The level represents the 61.8% of the move up from the 2013 low (see weekly chart below). The 200 week moving average is also being tested at the 0.8137 level. This area is key support as a result.

The 61.8% retracement at 0.8122, and 200 week MA (green line at 0.8137) are key support levels for the NZDUSD.


