
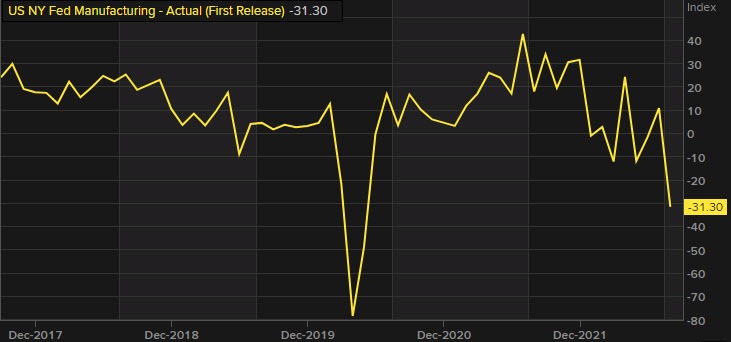
Empire manufacturing index for August
- Last month 11.1
- US Empire manufacturing index vs -31.3 vs. 5.0 estimate
- new orders -29.6 vs. +6.2 last month
- prices paid -55.5 vs. -64.3 last month
- prices received 32.7 vs. 31.3 last month
- employment 7.4 vs. 18.0 last month
- shipments -24.1 vs. +25.3 last month
- unfilled orders -12.7 vs. -5.2 last month
- delivery time -0.9 vs. 8.7 last month
- inventory 6.4 vs. 14.8 last month
- average employee workweek -13.1 vs. 4.3 last month
Going forward 6 months
- six-month business conditions +2.1 vs. -6.2 last month
- new orders 14.0 vs. 0.0 last month
- prices paid 49.1 vs. 43.5 last month
- prices received 43.6 vs. 20.7 last month
- number of employees 30.0 vs. 22.5 last month
- average employee workweek -10.9 vs. -9.6 last month
- capital expenditures 12.7 vs. 16.5 last month
- technology spending 10.0 vs. 12.2 last month
- shipments 18.7 vs. 7.2 last month
Big surprise for the regional index. The Fed wants slower growth in hopes to slow inflation , but not falling off a cliff. The level is the lowest since the plunge during the start of the Covid pandemic.
The Empire manufacturing is the 1st of the monthly regional manufacturing indices released by certain Fed districts
The data runs in contrast to the Michigan survey which saw a modest increase. Both are current economic views, one from consumers in the other from businesses.
Stocks are a little lower.

