It's looking like a mixed opening for the major US indices :
- Dow industrial average is up around 66 points or 0.19% at 34258
- S&P index is down -2.46 points or -0.06% at 4024.84
- NASDAQ index is down -53.34 points or -0.47% at 11232
- Russell 2000 was down -2.01 points or -0.11% at 1861.30
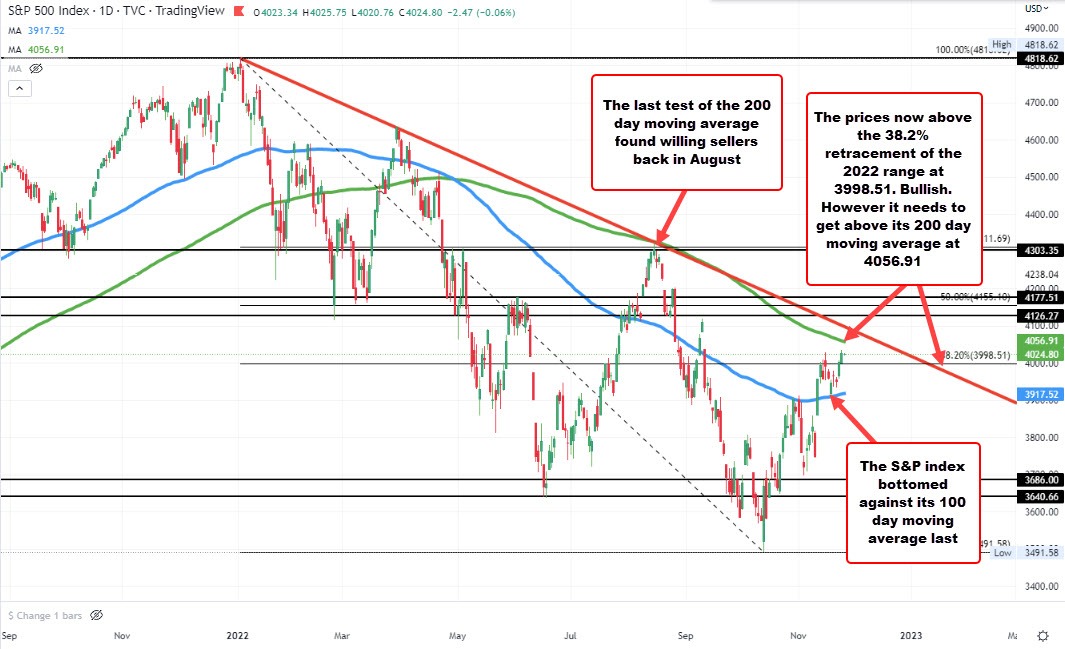
The S&P 500 index remains below its 200 day moving average up at 4056.90. The high price on Wednesday reached 4033.78. The high price back on November 15 extended to 4028.84. Back in August the high price reached 4325.28. That was just short of its 200 day moving average at the time at 4326.18.
The 200 day moving average is now 269.28 points lower. Below that is an easier hurdle to get to and through, it still represents a key technical level that traders will need to get above if the technical biases to turn more to the upside. Looking at the daily chart, the price is above the 38.2% retracement of the 2022 trading range. That level comes in at 3998.51. When back below that level would be a disappointment for traders hoping for further upside momentum. Last week the low price bottomed right near the 100 hour moving average give the buyers some added hope.