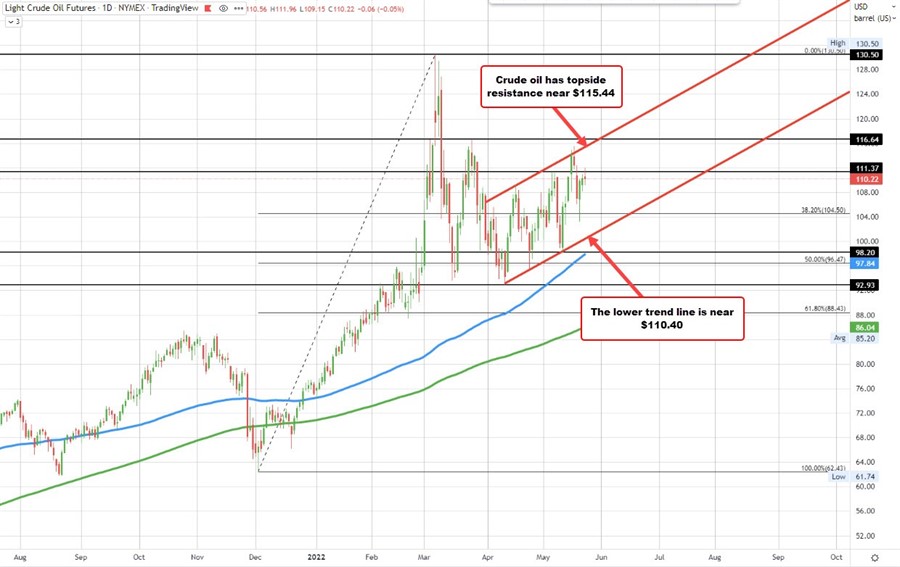
The price of WTI crude oil futures are settling at $110.29 That's up $0.01 or 0.01%.
The price high reached $111.96. The low price extended to $109.15.
On the daily chart, the price remains within a channel connecting recent highs and lows going back to April. Last week the price did extend above a topside trend line only to fail and move back toward the middle of the range. The topside trend line. The topside trend line cuts across at $115.44 and moving higher. The lower trend line cuts across near $110.40.
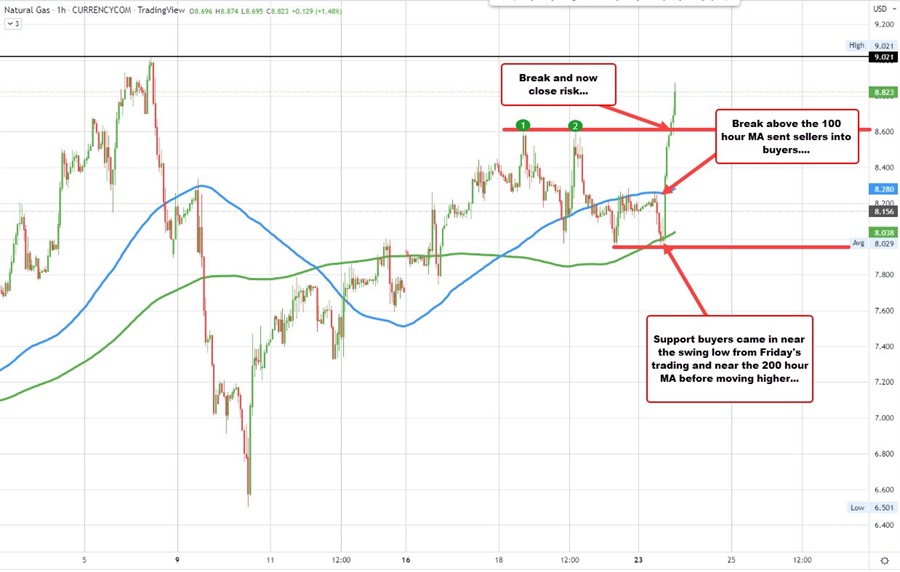
Meanwhile in the natural gas market, prices are soaring and up 8.19%.
After moving lower earlier in the session and testing its 200 hour moving average in the process, buyers re-entered against the 200 hour moving average (green line) and then broke above the 100 hour MA (blue line at $8.28 currently).
The next target came in at the highs from last week near $8.60, and extended even higher. The $8.60 is now close risk. The high from May 6th is the next upside target at $9.02.