100 hour MA held support in the Asian session. The rally stalled at a topside trend line.
The AUDUSD had a bunch of data release in the new trading day today. That data was not all that great. Retail sales were lower than expected. The trade surplus was also lower than the markets expectations.

That news did send the AUDUSD lower and from a technical perspective, the pair ran into two levels.
- One, a trend line connecting recent lows.
- The second was the 100 hour MA (blue line in the chart below).
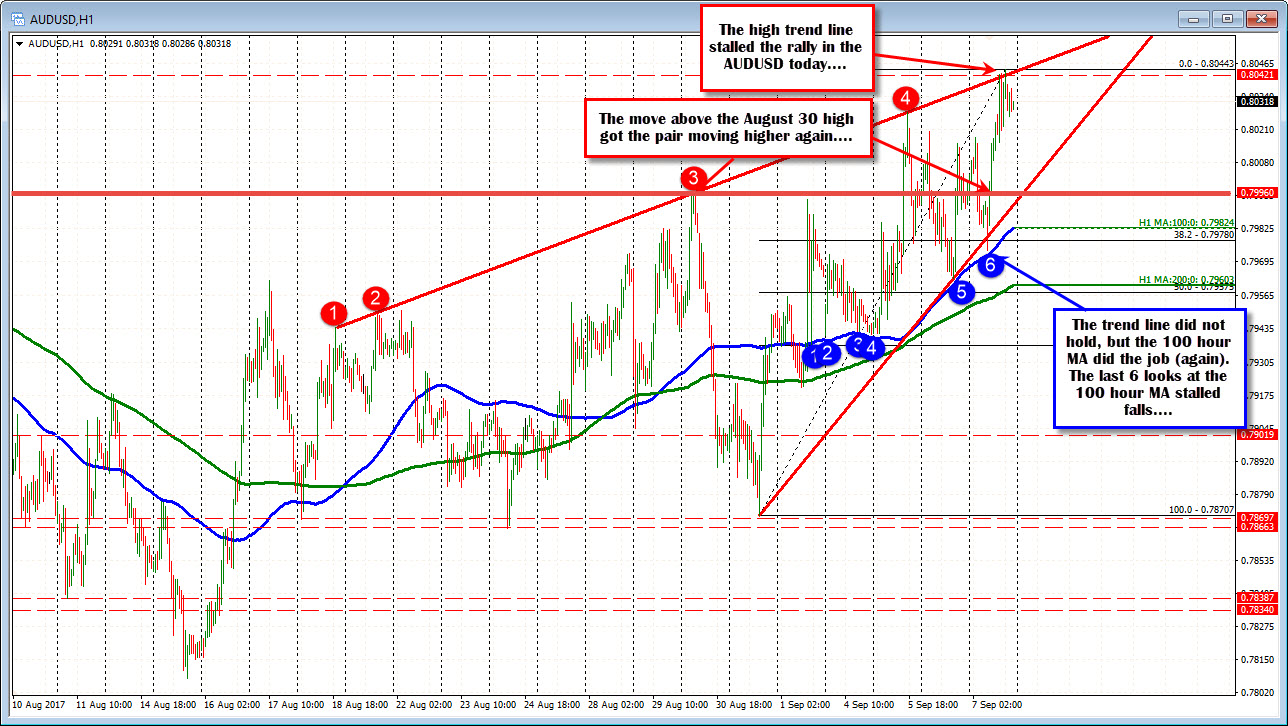
The thing about the 100 hour MA (blue line) is that the prior 5 tests held the level (see blue circles) The 6th test last night held again. The MA came in at 0.7972. The low price for the day? 0.79738.
Buyers will lean against a MA that held 5 prior times as risk is defined and limited. That trade idea, proved to be a good/low risk move. The price moved higher. (PS see the post from last night outlining that level as a key technical level).
Where did the price go off that support level?
Staying on the hourly chart above, the price moved back above the swing high from August 30 and that seemed to turn the technical bias higher. The rally did not stop until the price hit the upper trend line that connected the last 4 highs. Today, was the 5th. The price has rotated down a bit (see red numbered circles)
So there now is six tests of the 100 hour MA below (now at 0.7982 and moving higher), and 5 tests above (now at 0.8044 and also moving higher). Needless to say, a break of either should solicit more action in the direction of the break.
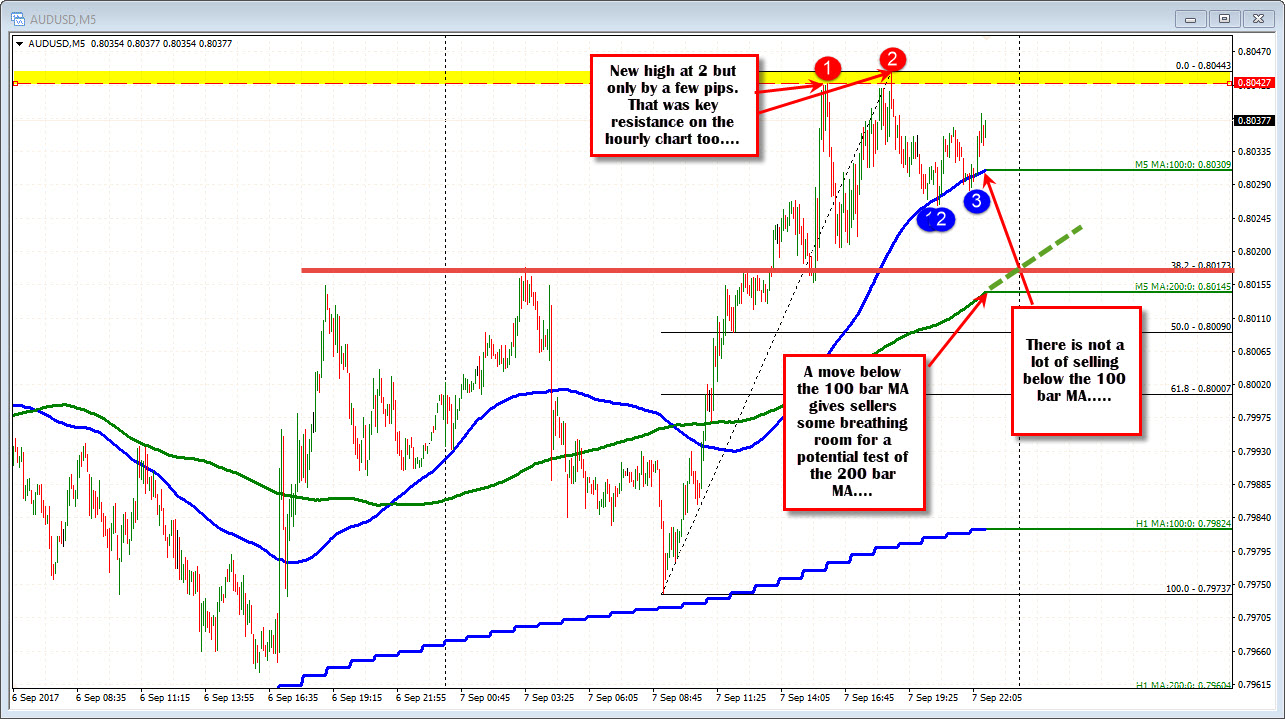
Drilling down to the 5-minute chart below, the price high at 0.8044 took out the prior day high but only by a few pips. That is a concern for the upside. However, on the move lower, the price has stalled twice against the 100 bar MA (blue line at 0.80309 currently). IF the price is to go lower, the sellers up against the trend line above, will need to see, the price break back below that MA level and then the 200 bar MA below.

SUMMARY.
The AUDUSD held support on the hourly chart after the weaker data. The 100 hour MA remains a key support target.
Above the trend line on the hourly chart held as resistance. That is a key resistance target.
The price has come off the high but there remains more work to go if the sellers are to take back a little more control. More specifically, get below the 100 bar MA. From there, the sellers can breathe a little more easily with the 200 bar MA at 0.80147 the next hurdle for more corrective potential.
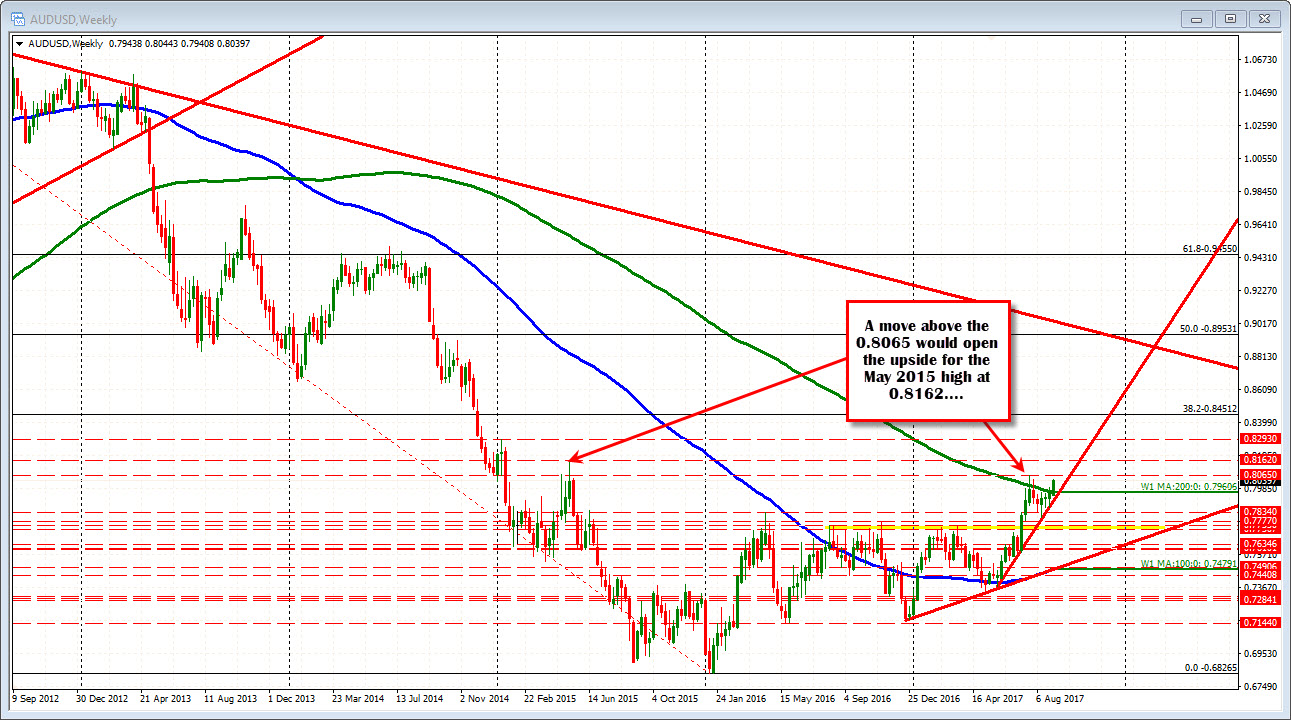
PS on a break of the topside trend line resistance looms the high price from 2017 at 0.8065. A move above that level starts to takes the pair to the highest level since May 2015. That May high came in at 0.8162 and it would be a target for the bulls.


