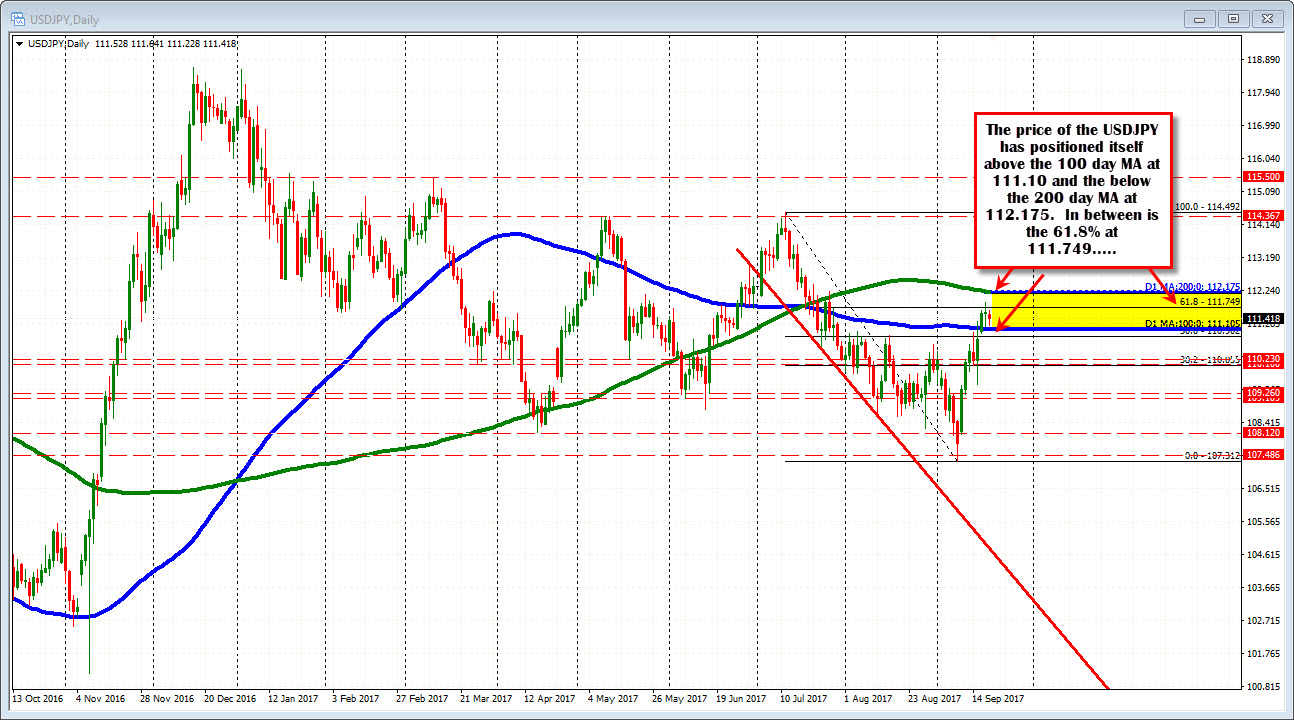
Trades near highs and above 100 day MA (but below the 200 day MA.
The FOMC decision will be later today (at 2 PM ET/1800 GMT) with the Fed expected to start the balance sheet contraction (see previews here). The balance sheet is just one piece. The other important part is the Fed's expectation on a rate hike before the year end. Will they or won't they signal one more? That answer could sway the dollar higher or lower.

To reflect that debate in technical terms, the price of the USDJPY has positioned itself between its 100 day MA at 111.10 (blue line in the chart above), and the the 200 day MA at 112.175 (green line in the chart above). In between those extremes is the 61.8% of the move down from the July high at 111.749. Keep those levels in mind through the FOMC reaction (it can be volatile at 2 PM and through the chair's press conference), and on breaks look for momentum. The current price is trading in the 111.40s
Drilling to the hourly chart (see chart below), yesterday the price tested a topside trend line and held. That trend line is extending higher and is above the 200 day MA now at 112.17. The trend line is currently at 112.22 and moving higher. A more hawkish Fed, and those levels are targeted.
The consolidation/correction lower over the last 24-plus hours has allowed the 100 hour MA (blue line) to play catch-up. It is currently just above the 100 day MA (blue line step line at 110.10) at 111.137. A move below both the 100 hour MA and the 100 day MA will be more bearish for the pair and start to target lower correction levels.
- The 110.978 is the 38.2% of the move up from last weeks low.
- Below that the 50% is at 110.70. The swing high from August 30 is at 110.66
- A broken trend line and the 200 hour MA comes in around 110.27-30 area
Those are step targets on a more dovish Fed.


