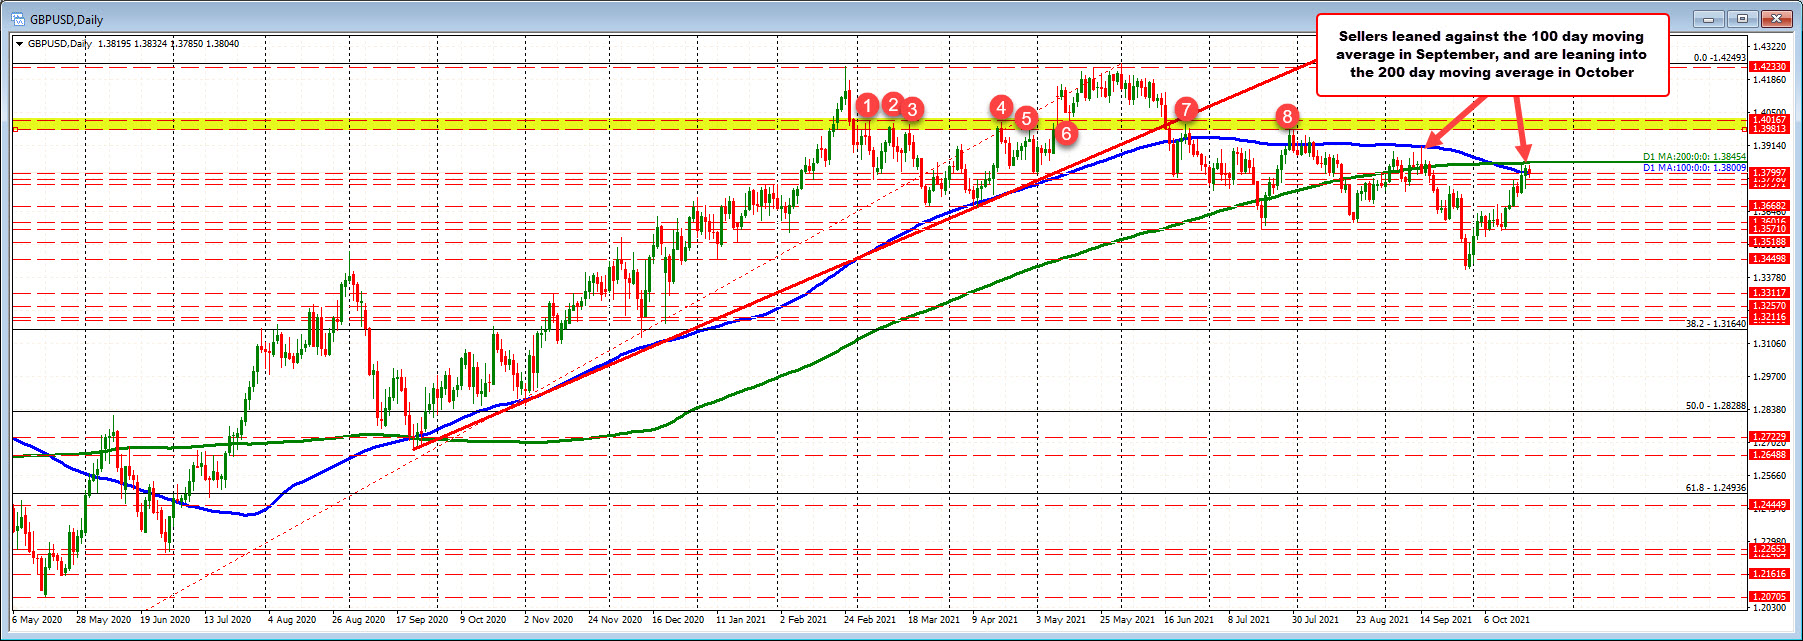
Price rises cannot approach the 200 day moving average at 1.3454
The GBPUSD moved up to retest its swing high from Tuesday and Wednesday at 1.3833 in the Asian session and stalled once again.
Those highs come in ahead of its key 200 day moving average at 1.38454. Sellers seem to be leaning with stops either on a break of the ceiling or a break of the 200 day moving average.
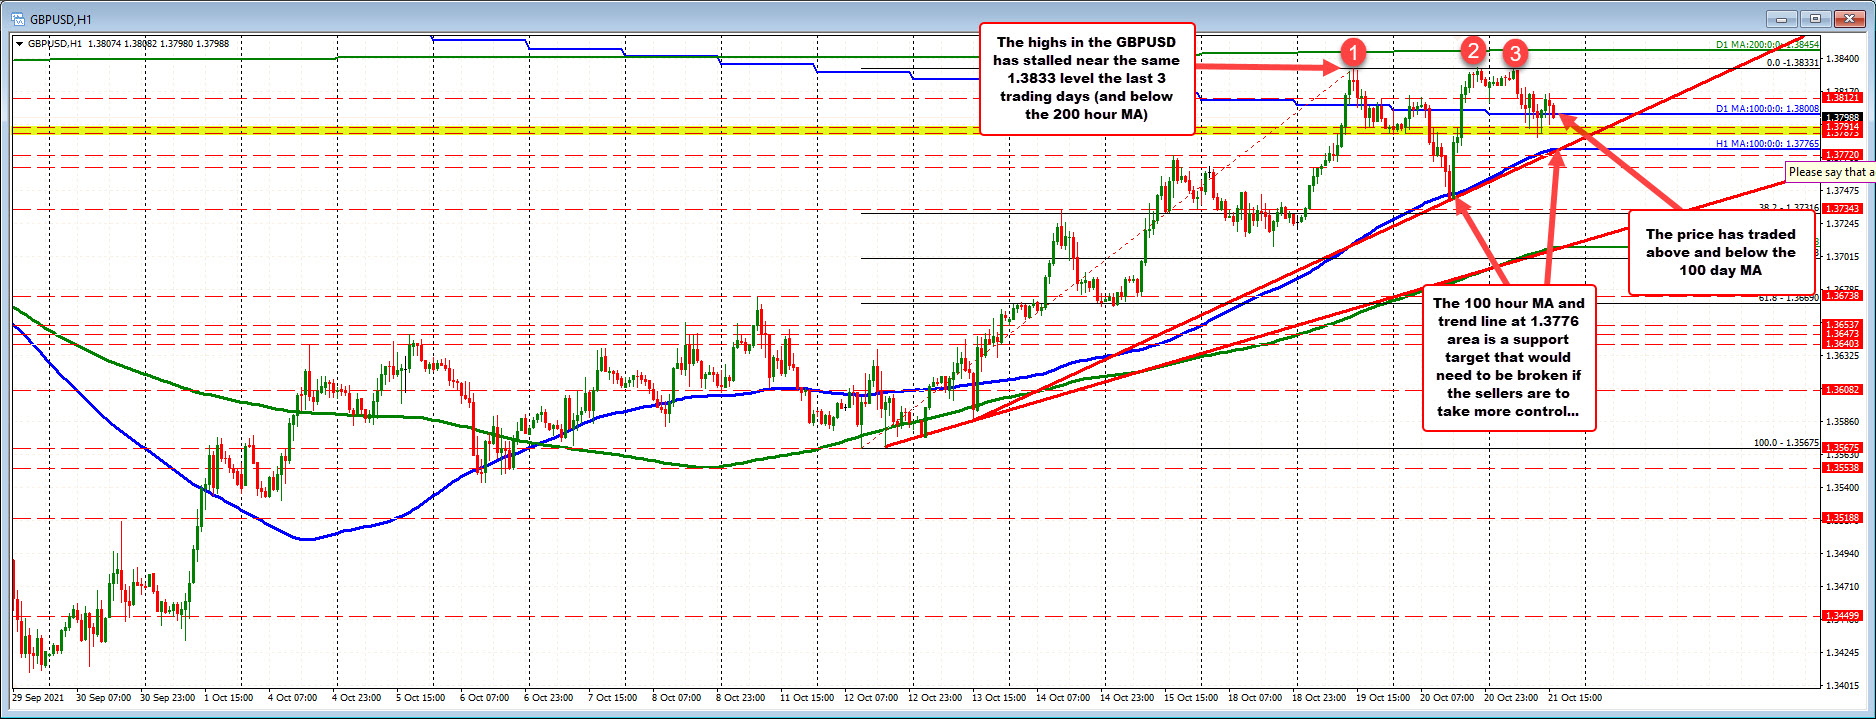
The subsequent fall to the downside has seen the price move above and below its lower 100 day moving average at 1.38009 today. The last three trading days has seen price action above and below that moving average level that traders decide on the next momentum shove.
Yesterday, the price moved further to the downside (after the rebreak of the 100 day MA), but found support buyers against its 100 hour moving average (lower blue line in the chart above). The price bounced quickly higher off that moving average level. The 100 hour moving average has now risen up to 1.37768. It is joined bythe rising trendline off of the October 13 low. On further selling momentum, that level will be a key barometer for the bias. Stay above is more bullish. Move below would increase the bearish bias.
Taking a broader look at the daily chart below, the GBPUSD in the month of September stalled against its 100 day MA. in October, the 100 and 200 day MAs have crossed and the sellers are leaning against the higher 200 day moving average this time.
The last time the price traded above both moving averages occurred in late July/early August, but upside momentum could not be sustained. A move above both moving averages would increase the bullish bias. Staying below keeps the sellers against the resistance level in play. When risk can be defined and limited traders will indeed look to lean with stops on a break. The 1.3981 to 1.4016 area (see red numbered circles in the chart below) is a key topside swing area that would be targeted on more upside momentum.