Closing the year near highs. Buyers in control.
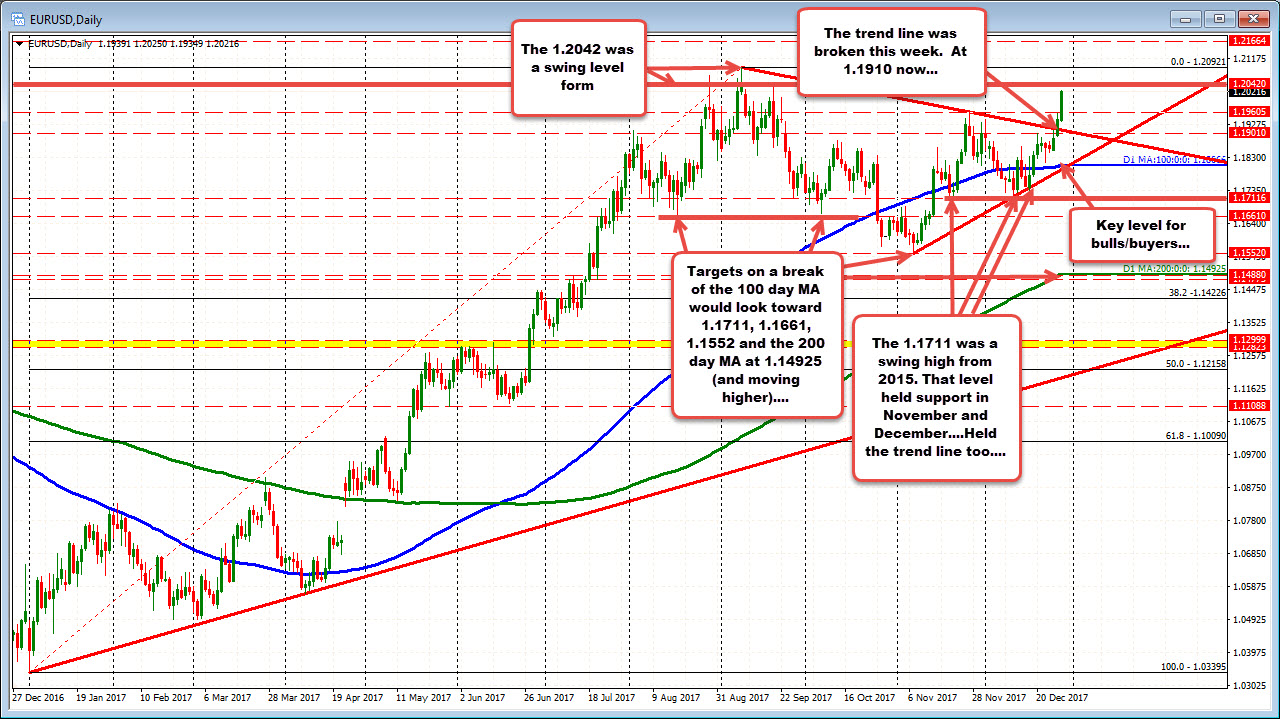
2017 saw the EURUSD start the year at the low (at 1.03395). The high was reached on September 8th at 1.20921. We currently trade around the 1.2021 level (give or take a few pips). Needless to say, that is close to the high for the year. The buyers are in control.

Having said that, the last 5 months has seen the price consolidate between 1.1552 and 1.2092. That area is above the 38.2% of the year's trading range (1.1422 is the 38.2% - see the chart above). So the buyers are still more in control, but there has been ups and downs in a fairly narrow trading range.
That consolidation has allowed the 100 day MA (blue line in the chart above) to catch up to the price. In October, November and December, the price has traded below that key bullish/bearish barometer. However, the last 8 trading days has seen the price move above, and close above the MA line. The line comes in at 1.1807. Staying above is more bullish and will be the closest bullish/bearish bias into the new year.
Other bullish developments recently have been the holding of trend line support in December (that trend line is around the 1.1800 level now - and moving higher), and the breaking of a topside trend line over the last two trading days (at 1.1910 currently). Those levels will be close risk levels for buyers. Move back below and the sellers will have wrestled more control from the buyers. NOTE: the 100 day MA at 1.1807 is near that lower trend line. That increases the levels importance going forward (see chart above).
A move below the 100 day MA would target the
- Swing area at 1.1661
- Low from November at 1.1552
- 200 day MA (green line at 1.14925). The price has been above the 200 day MA since April 24th.
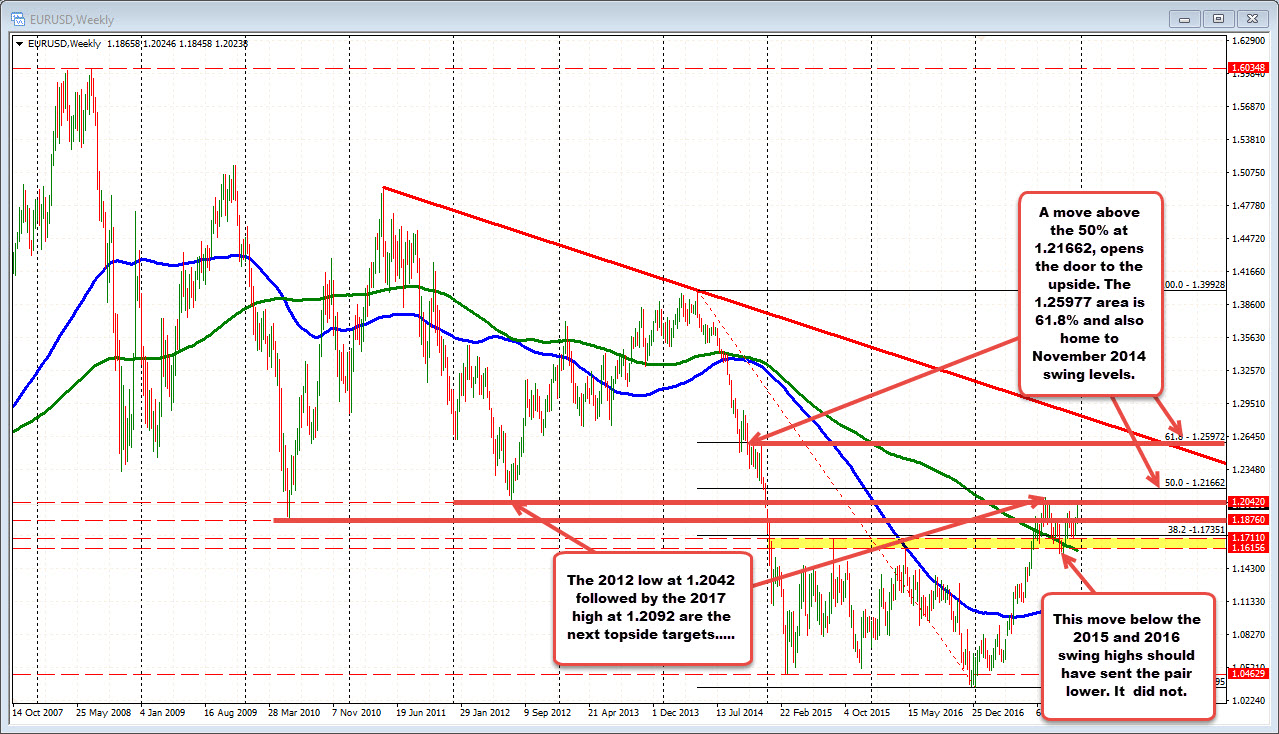
On the topside, looking at the weekly chart below, the 1.2042 was the swing low from July 2012. That is the next hurdle to get above and stay above.

After that,
- 1.20921 is the high for 2017.
- 1.21662 is the 50% of the move down from the 2014 high (see weekly chart below)
A move above the 1.2166 opens the door for a potential run toward 1.2600. The 61.8% is near that level. Also a swing high from the end of 2014 stalled just under that level. It sounds an ambitious target, but it is doable from a technical perspective.
Staying on the weekly chart, what has helped the bullish bias this year has been the move above the swing highs from 2015 (at 1.1711) and 2016 (at 1.16156). In October and November, the price of the pair moved below those highs to a low of 1.1552, but that break failed.
After moving back above the 1.1711 level in November, the swing low from November 21 stalled at 1.1712. Bullish hold. The low in December also held against that level. The low in December came in at 1.1717 (see the daily chart).


