
The NASDAQ back above its 200 hour moving average. S&P running away from its 50 day moving average
The major US stock indices continue to move higher. With the S&P index up about 34 points or 0.77% at 4473. The NASDAQ index is up about 70 points or 0.48% at 14894.

For the S&P index, it close just above its 50 day moving average yesterday currently at 4472.75, and gapped above that level today. A move back below the 50 day moving average is needed to hurt the bullish technical bias now.
The index is within 1.6% of its all-time high reached in the beginning of September at 4245.85.
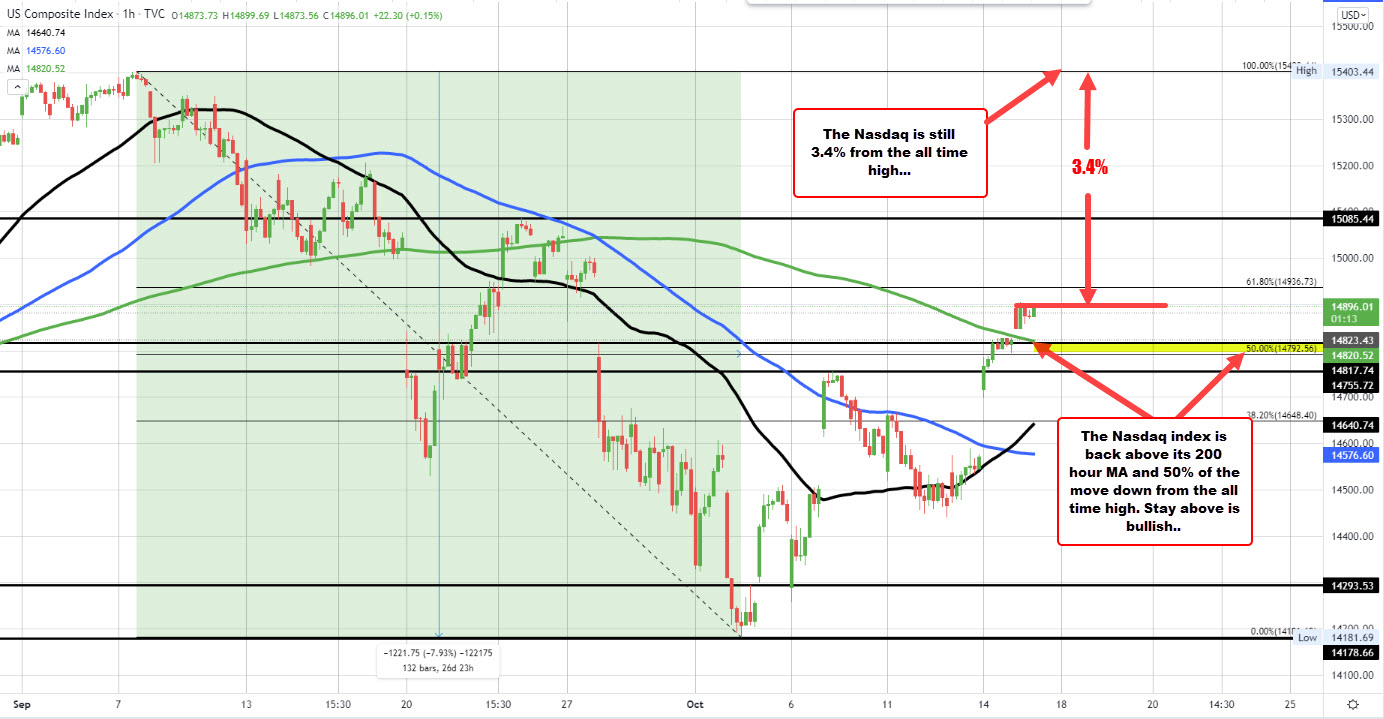
For the Nasdaq index (see the hourly chart below), it has moved above its 200 hour moving average today at 14896.01. Yesterday the index moved above the 50% midpoint of the move down from the September all-time high to the October low at 14792.56. Those levels are now risk levels for the index. Stay above and the buyers remain in full control.
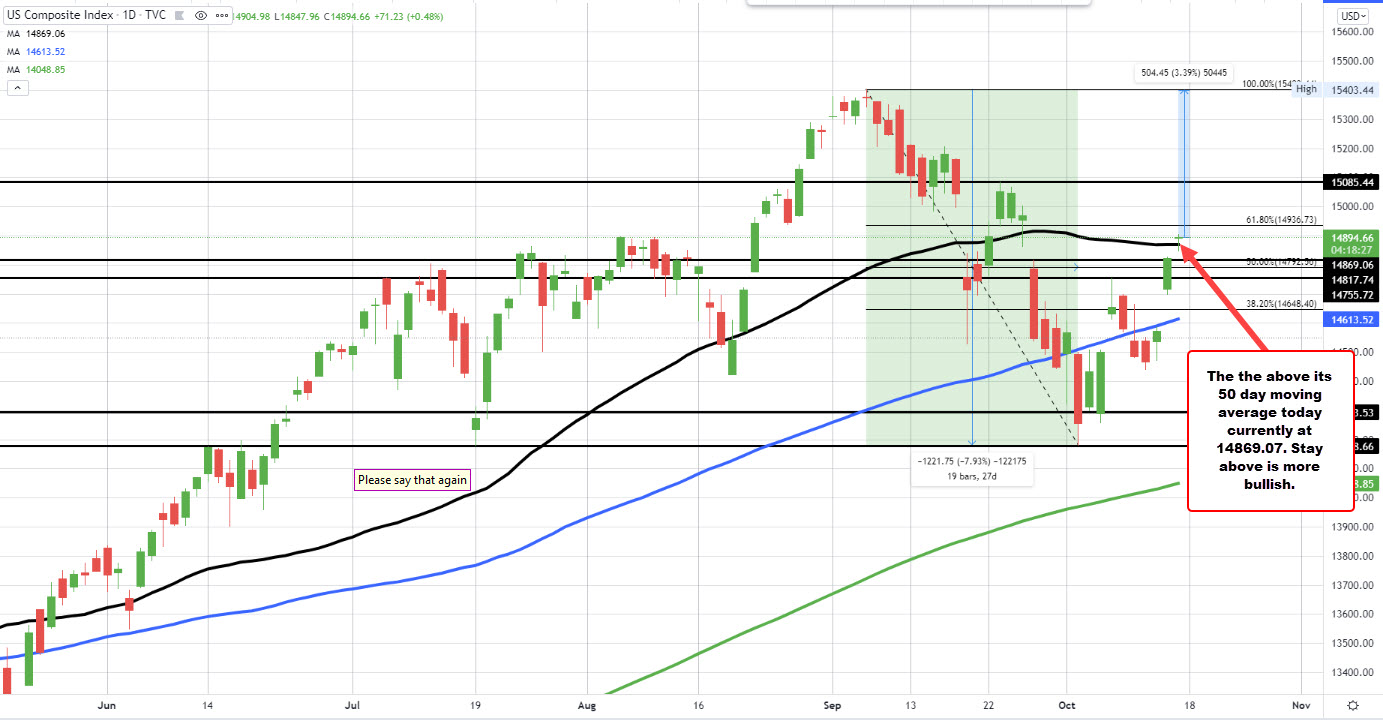
The NASDAQ index also moved above its 50 day moving average at 14869 today.
The index is still 3.4% from its all-time high of 15403.44. As interest rates rise, the NASDAQ index tends to lag due to the higher valuation for the more high-tech stocks.

