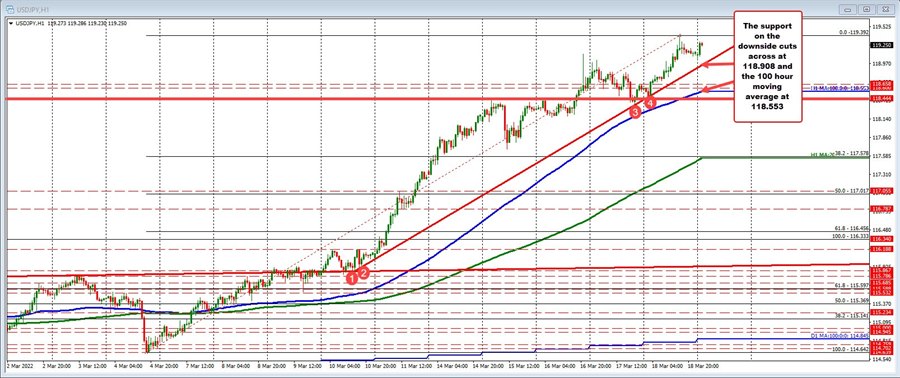
Japan is on holiday in observance of vernal equinox day, but that is not stopping the USDJPY from moving higher in early trading.
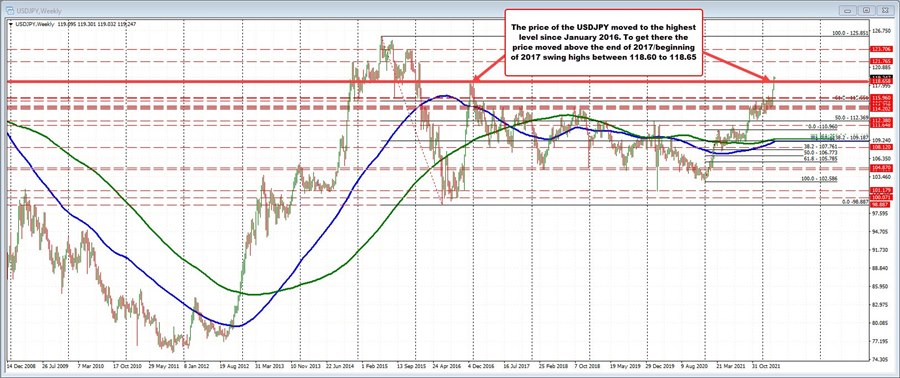
The pair did move back higher on Friday after Thursday's modest dip broke a string of eight consecutive higher closes. The high price on Friday also saw the pair move to the highest level since the end of January 2016 to 119.392 (see daily chart below), before dipping modestly into the close (closed at 119.14).
Today the price is moving higher with the pair just reaching a intraday high of 119.30. The next key target remains the high from Friday at 119.392.
What would hurt the bullish bias on the hourly chart?
A trendline from March 10 connects recent lows from Thursday and Friday and cuts across at 118.908 currently (and moving higher - see red numbered circles on the hourly chart above).
A move below that level would have traders targeting the rising 100 hour moving average currently at 118.553. The price of the USDJPY has not traded below its 100 hour moving average since March 7 when the moving average was down at 115.29.
Below the 100 hour moving average and the 118.44 level would be another target to get to and through to increase the bearish bias
Taking a broader look at daily chart below, the price last week moved above the end of 2016/beginning of 2017 swing highs between 118.60 and 118.658. That area (just above the rising 100 hour MA) will also be a key support and bias defining level this week.
Move below that area (and the 100 hour MA) and there should be more selling momentum on the disappointment from the break higher.


