

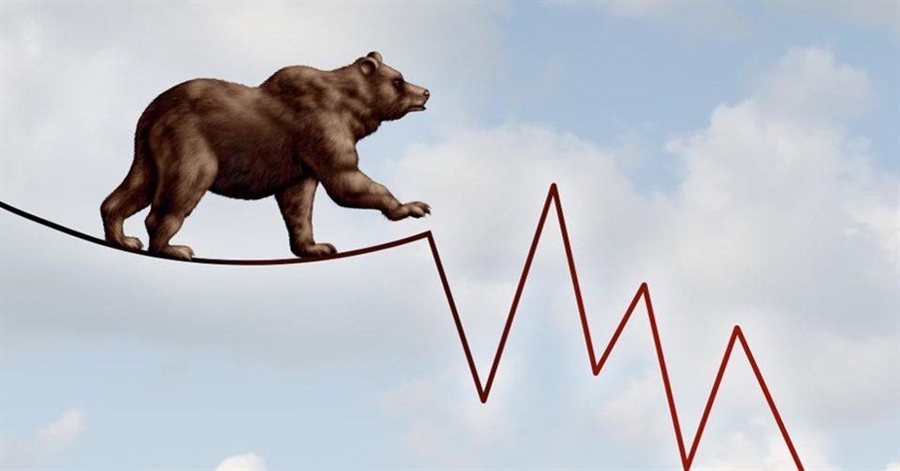
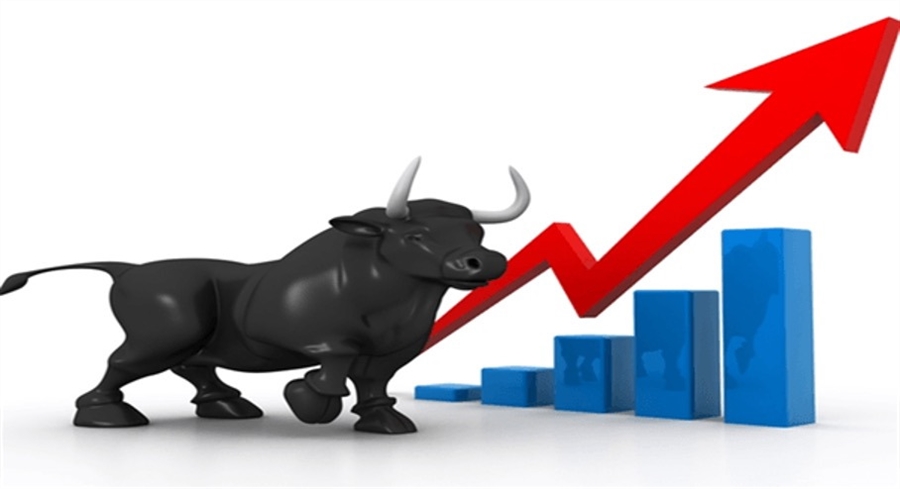
The bull market is a term that describes when the market is rising or expected to rise. On the other hand, a bear market occurs when the price of an asset falls 20% or more for a continuous period. A bear market is a market in decline.
The market's direction is a dominant force that affects the portfolio of any investor or trader. But it isn't always easy to predict the market's direction. However, there are a lot of differences between these two markets, each with its own pitfalls and advantages.
So, knowing what to look out for right from the start will determine what strategies you use and influence trading decisions as you attempt to take advantage of the trend or protect your assets.
Traders use various methods to figure out the market trends. One of them is to trade the bullish engulfing candle as an indicator of when to enter a trade or position. You will learn more about this method further down the article.
Differences Between the Markets
The best way to know whether or not the market is becoming bullish or bearish is to examine these key areas:
1. Market performance
In a bull market, the price of assets rises because of the increase in buyers and investors. Therefore, even when the market experiences a few corrections, investors are willing to risk their capital because they believe the market will continue to rise for a while. An increase in GDP growth also marks a bull market, high employment rate, increase in sales and industrial output.
In a bearish market, the price of assets is either steady or gradually losing value. Investors' fear of falling prices usually facilitates the continued downtrend.
Other areas of the economy will experience a decline as well, with a decline in GDP growth and a decrease in industrial output. The value of the country's currency also drops during a bear market.
2. Interest Rates
One of the hallmark traits of bull markets is rising or high-interest rates. This is done to make the economy more attractive to foreign investors who will benefit from the higher interest rates.
Increasing the interest rate also serves as a means of checking the rise of inflation or speculative bubbles (a situation where the price of an asset(s) rises beyond its intrinsic value due to speculation). Plus, it controls excess liquidity in the economy.
By contrast, a bearish market will result in lowered interest rates. As buyers check out of the market and selling pressure increases, interest rates will be reduced to encourage more borrowing and business growth. During this time, foreign investors may pull out of the economy or avoid investing in it.
3. Changes in Exchange Rate
Since the economy is strong in a bull market, the currency also becomes more valuable. A bullish market increases the demand for a country's currency, thereby strengthening it against other currencies.
A strong exchange rate can result in more profit for forex traders and make importing goods easier.
As investors pull out of the economy in a bear market, the demand for the currency drops, affecting its value and exchange rate. It also makes imports more expensive and can also affect trading activities.
4. Inflation
Typically, the high demand for goods and services in a bull market will result in rising levels of inflation.
The opposite will occur in a bear market where the price of goods and services will drop to increase customers' purchasing power. However, it is still possible for inflation to occur in a bear market.
5. Consumer sentiment
Consumer or investor sentiment does have an impact on which direction the market goes. In a bull market, consumer sentiment is strong because of how well the economy is doing. This makes them more likely to spend and invest because they believe the economy will continue to grow.
But in a bear market, investors and consumers are more likely to save their money because of their distrust of the market. When this happens, it can cause the market to decline even further because of the increase in the outflow.
How to Predict a Bull or Bear Market
Predicting the potential direction of the market is always a tricky task for investors and traders. You want your predictions to be as accurate as possible to avoid being affected by swings or pullbacks when trading.
To determine the possible direction of the market, you should consider:
Using chart patterns
Chart patterns are formed when the market moves in a certain way. The patterns resulting from past price movements act as a tool for traders to determine future market movements. In addition, these patterns can be used to examine different markets, including stocks, commodities, forex, and more, making them an integral part of technical analysis.
Chart patterns can either be bullish or bearish depending on the information they show and how they influence trading decisions. For instance, traders identify and trade the bullish engulfing candle as a buying opportunity to take advantage of the impending bullish trend.
Understanding and recognizing chart patterns will give you a competitive edge in the market and increase the effectiveness of your technical analysis strategy. But there are several chart patterns, and learning to identify them can be a difficult task for amateur traders.
So, it is advisable to familiarize yourself with popular patterns like wedges, triangles, and channels, then gradually build your knowledge as you continue in the market. In addition, some forex brokers include tools in their programs that make identifying patterns easier for traders.
Remember that while these patterns give indications about future price movements, they should not be relied on completely and needs to be confirmed with technical indicators.
Fundamental analysis
Fundamental analysis focuses on various key factors that can affect the direction of a market. It gives investors or traders crucial insight into economic and geopolitical events that will have the most impact on the price of assets.
There are a lot of elements traders need to pay attention to when it comes to fundamental analysis, but economists have narrowed it down by creating the economic calendar.
The economic calendar is a simplified way to view major economic events in different countries like interest rate, GDP, trade balance, and situation of employment.
It allows you to gauge the impact the events will have when they are announced and note predictions from other economists. When using the economic calendar to make predictions, it is advisable to focus more on events that command the most attention, especially from countries like the US.
Announcements from major countries tend to have a global impact and can indicate future market direction. It is necessary to still confirm the analysis with technical indicators to increase its accuracy and reliability.
Shifts in Volume
Examining volume patterns can give you an idea of how strong the bullish or bearish trend in the market is going to be. For instance, if a bear market is in place, but the volume of assets rises, it means that more buyers are entering the market, and there is an imminent reversal.
But if the volume of assets falls in a bullish market, it shows that the buyers have reduced, and there could be a potential reversal.
For analyzing the volume in the market, traders use:
- On-Balance Volume Indicator: This is a cumulative indicator that measures buying and selling pressure. It is relatively simple to use as volume is added on up days and subtracted on down days.
- Volume Price Trend Indicator: This volume indicator analyzes the strength of changes in price and also the direction of the asset.
- Chaikin Money Flow Indicator: This is an indicator that calculates volume based on the price change of an asset.
- Klinger Oscillator: This is a volume indicator that sums up the buying and selling volumes over a specific period of time.
Although volume indicators are handy tools for measuring the strength or weakness of the market, they do not always give precise information. Therefore, it is preferable to make them a part of your trading strategy rather than a standalone method.
The Bottom Line
The common mantra is to buy when the prices are low and sell when the prices are high in order to make some profit. While this is good advice, it is also important not to make trading decisions based on the price of the security alone.
The best way to have an edge is to conduct an analysis to uncover the factors influencing the price of the asset. Also, combining fundamental analysis with your technical analysis strategy will provide you with the strong foundation needed to make trading decisions. Both markets present opportunities to traders, and regardless of the market in place, your success depends on how your ability to maneuver through it.

