
US:
- The Fed left interest rates unchanged as expected at the last meeting.
- The macroeconomic projections were revised higher as the economy showed much stronger resilience than expected and the Dot Plot showed that the majority of members still expects another rate hike by the end of the year with less rate cuts in 2024.
- Fed Chair Powell reaffirmed their data dependency but added that they will proceed carefully.
- The latest US Core PCE came in line with expectations with disinflation continuing steady.
- The labour market remains fairly solid as seen last week with another strong beat in Jobless Claims and the NFP report.
- The ISM Manufacturing PMI beat expectations while the ISM Services PMI came in line with forecasts in another sign that the US economy remains resilient.
- The market doesn’t expect the Fed to hike anymore.
Australia:
- The RBA kept interest rates unchanged as expected as they are seeing inflation returning to target with the current level of interest rates.
- The latest monthly CPI showed that core inflation is slowing.
- The labour market is weakening as we got a big miss in July and the bulk of jobs added in August were part time.
- The Australian Manufacturing PMI fell further into contraction while the Services PMI jumped back into expansion.
- The market expects the RBA to hold rates steady at the next meeting as well.
AUDUSD Technical Analysis – Daily Timeframe
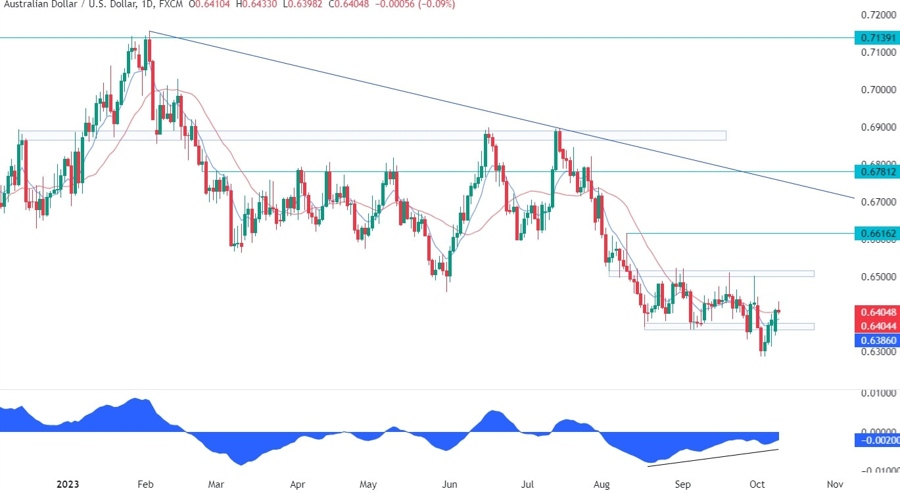
On the daily chart, we can see that the AUDUSD pair was diverging with the MACD right when it was trying to break out of the range. This is generally a sign of weakening momentum often followed by pullbacks or reversals. In this case, the pair failed to sustain the breakout and bounced back into the range. The buyers might now have enough conviction to target the top of the range around the 0.65 handle.
AUDUSD Technical Analysis – 4 hour Timeframe

On the 4 hour chart, we can see that the price action within the range is a real mess with frequent spikes and erratic movements. From a risk management perspective, the buyers would be better off to wait for the price to pull back into the lower bound of the regression channel around the 0.6380 level where they will also have the confluence with the red 21 moving average. The sellers, on the other hand, will want to see the price breaking below the support zone around the 0.6370 level to position again for new lows.
AUDUSD Technical Analysis – 1 hour Timeframe

On the 1 hour chart, we can see more closely the bullish setup with the 61.8% Fibonacci retracement level adding further confluence to the support around the 0.6380 level. As previously mentioned, the sellers will want to see the price breaking below the lower bound of the channel to invalidate the bullish setup and position for another selloff into new lows.
Upcoming Events
This week the market is likely to focus on the CPI report as that’s what might change the expectations around the next FOMC rate decision. Tomorrow, we will see the US PPI data and later in the day the FOMC Meeting Minutes. On Thursday, it will be the time for the US CPI report, and at the same time we will also get the latest Jobless Claims figures. On Friday we conclude the week with the University of Michigan Consumer Sentiment report.

